02 October 2016
Election Year Stock Market Watch: What Happened in the Past Elections?
Historically, the performance of our US stock markets has been watched, measured, feared and cheered every election year. While the past may be interesting and helpful in understanding the whole picture of our historical election year returns, it can’t be viewed as the way that things will go tomorrow. Make no mistake, the election year market returns history is definitely a great place to start in watching the markets during this election cycle!
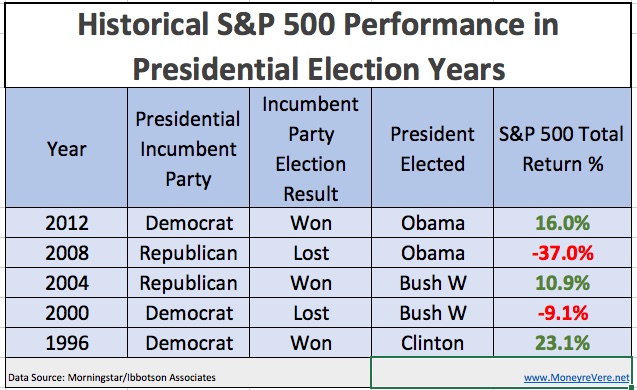
In November of every election year, three major leadership decisions are being made by American voters. We decide on our US President, Vice President and the US Senate. History shows us that as there are shifts in the political party among the President/Vice President team we see downward trends in the gains of the S&P 500 Market Index. Taking the last 5 elections into account, the following chart shows a 20-year post-election market performance trend.
 This chart shows that when the incumbent president party won the election there was an upswing in the S&P 500 for the year. There was an S&P 500 loss for the year if the incumbent presidential party did not prevail. If this trend carries over to the 2016 election, we will see a 2016 market upswing with a Clinton victory and a market downswing with a Trump presidential win.
 Read the next post in this series
 Read the previous post in this series
 This chart shows that when the incumbent president party won the election there was an upswing in the S&P 500 for the year. There was an S&P 500 loss for the year if the incumbent presidential party did not prevail. If this trend carries over to the 2016 election, we will see a 2016 market upswing with a Clinton victory and a market downswing with a Trump presidential win.
Why is the S&P 500 used as a market benchmark?
The Standard and Poor’s 500 is a market index of 500 of the largest publicly traded US companies. These companies represent all market sectors. The 10 major market sectors are Basic Materials, Consumer Discretionary, Financials, Consumer Staples, Healthcare, Utilities, Telecom, Energy, Industrials and Technology. Every stock traded in the US falls within one of these sectors and the S&P 500 is comprised of a good mix of all of these areas. Although there are arguments against this theory, many analysts feel that the S&P 500 is a good benchmark of the overall health of our US financial markets. Again, past performance is not necessarily a glimpse into tomorrow’s reality. As we focus on stock market performance in an election year, looking at what happened in the past election years is a crucial step in establishing a baseline as we get closer to our 2016 presidential election. Stay tuned. There’s more to come! Read the next post in this series
 Read the previous post in this series