
17 October 2016
Pre-Election Stock Market Focus #4: What the market is doing in 2016 (thus far!)
In continuing to examine our pre-election focus on our financial markets, let’s take a look at where our key stock market indices are today and look back at how they measured at the first of this election year. We’ll also make note of the all-time highs for each of the major indices – The Dow, S&P and the NASDAQ. This chart does just that!
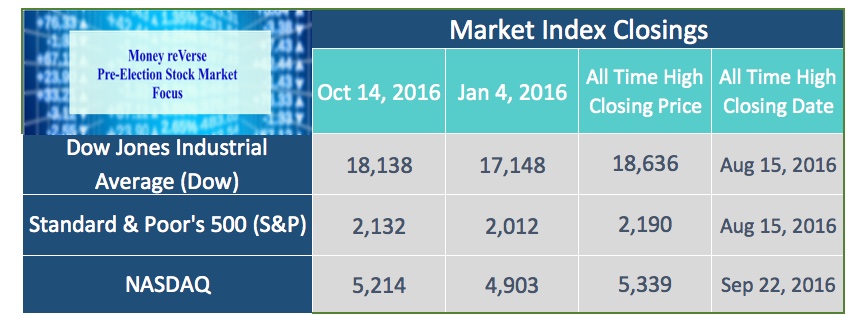 This chart shows the following pair of interesting facts:
1. The Dow, S&P and NASDAQ are all trading higher today than they did at the beginning of the year.
2. The Dow, S&P and NASDAQ set new all-time highs in 2016. These new highs have been in the record books for just over 60 days.
With all-time high records being set on all three indices, there is a high likelihood that there will be a market pullback in the future. All-time highs often result with a pullback and a market ""running start" before the next all-time high mark is hit. We are seeing that now as there has been a decrease in the index values since the Summer 2016 high values.
We’re still doing a pre-election focus on our financial markets. Stay tuned for more!
Carolyn
This chart shows the following pair of interesting facts:
1. The Dow, S&P and NASDAQ are all trading higher today than they did at the beginning of the year.
2. The Dow, S&P and NASDAQ set new all-time highs in 2016. These new highs have been in the record books for just over 60 days.
With all-time high records being set on all three indices, there is a high likelihood that there will be a market pullback in the future. All-time highs often result with a pullback and a market ""running start" before the next all-time high mark is hit. We are seeing that now as there has been a decrease in the index values since the Summer 2016 high values.
We’re still doing a pre-election focus on our financial markets. Stay tuned for more!
Carolyn
 View Previous Post in this Series
 View Next Post in this Series
This chart shows the following pair of interesting facts:
1. The Dow, S&P and NASDAQ are all trading higher today than they did at the beginning of the year.
2. The Dow, S&P and NASDAQ set new all-time highs in 2016. These new highs have been in the record books for just over 60 days.
With all-time high records being set on all three indices, there is a high likelihood that there will be a market pullback in the future. All-time highs often result with a pullback and a market ""running start" before the next all-time high mark is hit. We are seeing that now as there has been a decrease in the index values since the Summer 2016 high values.
We’re still doing a pre-election focus on our financial markets. Stay tuned for more!
Carolyn
View Previous Post in this Series
View Next Post in this Series